Are you familiar with AAS aka Average Active Session Metric? If not, don’t worry you are not the only one.
There are lots of good articles and slides on AAS, if you know to look for it.
What do you think of when you hear Average Active Sessions?
When I hear Average Active Sessions in the database, I would think about the actual number of sessions, you know, the users connected to the database and doing work.
But to be honest, this metric is not related totally to the number of connected users to the database. This metric is actually a great measuring stick for the performance in the database.
Before we dive in to understand this metric, we need to understand what the DB Time metric is, and what is the difference between DB Time and the actual Elapsed Time or Clock Time.
At any given time, there are users connected to the database, each of them performing some work, a query, an update…a report. Some sessions might be idle, some might be waiting on resources, some might be actively doing work. The sessions are using resources: CPU, I/O.
To make it clear, DB Time is not the same as Elapsed Time or Clock Time.
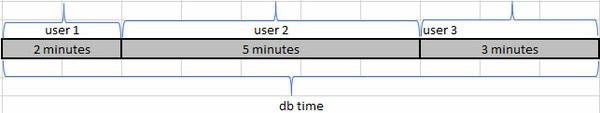
Oracle defines Database Time as the total time spent by foreground sessions executing database calls.
To better understand this concept, let’s look at a very simplified example.
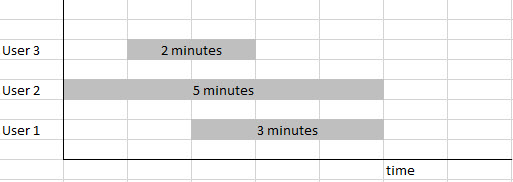
Lets say that there are 3 sessions in the database that are actively working.
The first session completes its work in 2 minutes.
The second session completes its work in 5 minutes.
The third session completes its work in 3 minutes.